Plot_ALIGE
Plot_ALIGE.Rdplot ALIGE with 95% confidence intervals
Plot_ALIGE(tvals, ALIGE, sd_ALIGE, xlab, ylab, ylim = c(0, 1))
Arguments
| tvals | a grid of values of treatment variable |
|---|---|
| ALIGE | lige from |
| sd_ALIGE | SD of ALIGE |
| xlab | name of x axis |
| ylab | name of y axis |
| ylim | ranges of values for y axis |
Value
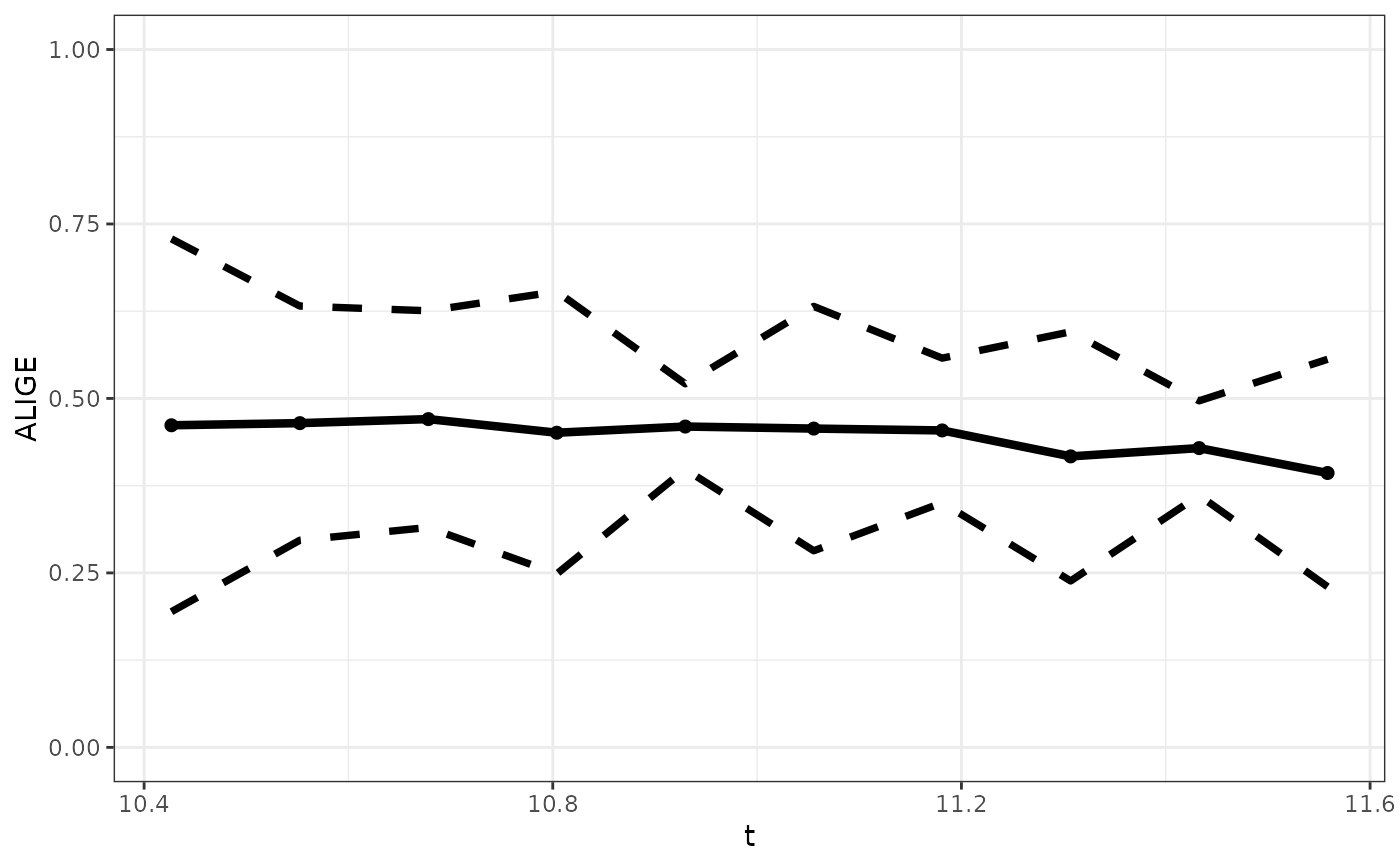
Plot of ALIGE
Examples
data(igm)
igm$hs=ifelse(igm$HEDUC=="HS",1,0)
igm$col=ifelse(igm$HEDUC=="COL",1,0)
formla=lcfincome~lfincome
xformla=~hs+col
tvals=seq(quantile(igm$lfincome,probs = 0.1),quantile(igm$lfincome,probs = 0.9),length.out = 10)
h=1.2
data=igm
cl=1
B=7
ALIGE=localIGE(formla=formla, xformla=xformla, data=data,tvals=tvals,h=h,cl=cl)
sd_ALIGE=sdF(B,formla=formla, xformla=xformla, data=data,tvals=tvals,h=h)
Plot_ALIGE(tvals,ALIGE,sd_ALIGE,xlab="t",ylab="ALIGE",ylim=c(0,1))